
Although nutrient enrichment threatens many New Zealand estuaries, guidance on how to assess the extent of eutrophication (including indices and indicators that are useful for management) is limited. As a result, it has been difficult to:
- Determine the current state of estuaries with regard to eutrophication;
- Assess the effects of the recent landuse intensification and change on estuaries;
- Gauge the consequences for estuaries of nutrient limits for freshwater (e.g., the National Policy Statement for Freshwater Management, NPSFM, 2020); and
- Set nutrient load limits to achieve estuarine objectives.
In response, regional council coastal scientists sought advice via the coastal Special Interest Group (cSIG), with funding through Envirolink Tools Grant (Contract No. C01X1420), on the development of a nationally consistent approach to the assessment of estuary eutrophication, including nutrient load thresholds. The purpose of this project, called the NZ Estuary Trophic Index (ETI), is to assist regional councils in determining the susceptibility of an estuary to eutrophication, assess its current trophic state, and assess how changes to nutrient load limits may alter its current state. The project does this by providing tools for determining estuary eco-morphological type, where an estuary sits along the ecological gradient from minimal to high eutrophication, and providing stressor-response tools (e.g., empirical relationships, nutrient models) that link the ecological expressions of eutrophication (measured using appropriate trophic state indicators) with nutrient loads (e.g., macroalgal biomass/nutrient load relationships).
In terms of the regional council planning framework, the ETI provides vital supporting guidance for underpinning the ecological health component of regional plans by identifying relevant estuary attributes and outcomes for inclusion in plans, defining methods and indicators to measure ecosystem health attributes, and providing guidelines to assess whether or not the outcomes are being met.
The ETI provides three tools:
- Tool 1: Determining eutrophication susceptibility using physical and nutrient load data
- Tool 2: Assessing Estuary Trophic State using measured trophic indicators
- Tool 3: Assessing Estuary Trophic State using a Bayesian Belief Network
Details of when to use each tool and the knowledge underpinning the tools can be found on the Welcome and Background Information tabs, respectively, for each tool.
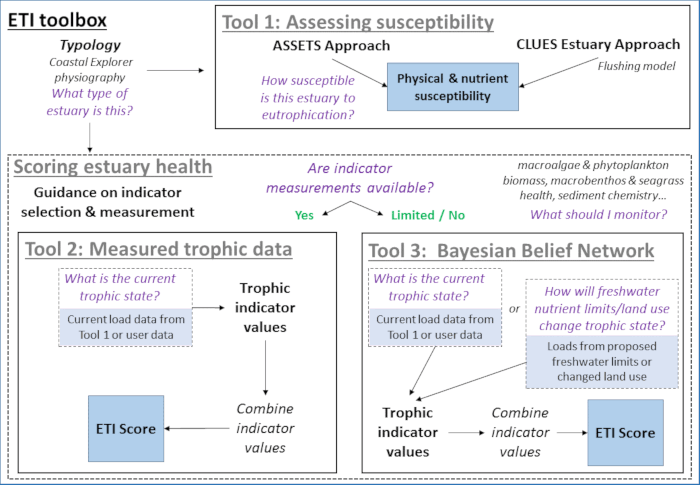
Figure 1. Concept diagram of the ETI, showing relationships between ETI Tools 1, 2 and 3. Tool 1 provides information on estuary susceptibility to eutrophication based on estuary type, its physical attributes and nutrient loading. Tool 2 provides scores for estuary trophic health based on measured trophic indicator values. Tool 3 provides trophic scores under under scenarios of changed land use or load limits, and/or when values of trophic state indicators are lacking.
Disclaimer
Whilst NIWA has used all reasonable endeavours to ensure that the information contained in this website is accurate, NIWA does not give any express or implied warranty as to the accuracy of the information contained herein. This website has been reviewed internally by NIWA and meets NIWA standards for website delivery.
This tool uses knowledge of the ecological connections between drivers of estuary trophic condition (e.g., estuary type, nutrient and sediment loads, estuary closure state) and responses of indicators (e.g., muddiness, macroalgal and macrobenthic health indices) to calculate an ETI score using a Bayesian Belief Network (BBN) (see Glossary for definitions of words in bold). The overall structure of the Tool 3 BBN and the ecological and physiographic information underpinning the connections between its nodes is described in depth in Zeldis & Plew (2022). This information was accumulated from knowledge based on NZ and international estuarine science.
When to use ETI Tool 3
The ETI scoring is similar to that of Tool 2, but the Tool 3 BBN can operate when no or few values are known for the primary indicator nodes and secondary indicator nodes. It therefore is most useful when either:
- you have little or no knowledge of the state of indicators for an estuary;
- you wish to test the response of estuary trophic condition to changes in loads resulting from altered land use or point sources;
- you wish to test the response of estuary trophic condition to load limit-setting scenarios in upstream catchments.
ETI Tool 3 contains a BBN suitable for use with shallow intertidal dominated estuaries (SIDEs), shallow, short residence time tidal river and tidal river with adjoining lagoon estuaries (SSRTREs) and coastal lakes. ETI Tool 3 is applicable to any of these estuary types using data for its driver nodes available from Tool 1. If independent values of intermediate, primary or secondary nodes are known by the user, they can be used to inform, and potentially improve, the predictions of the BBN.As well as for permanently open estuaries, Tool 3 can be applied to intermittently closed / open estuaries (ICOEs; see Background information tab).
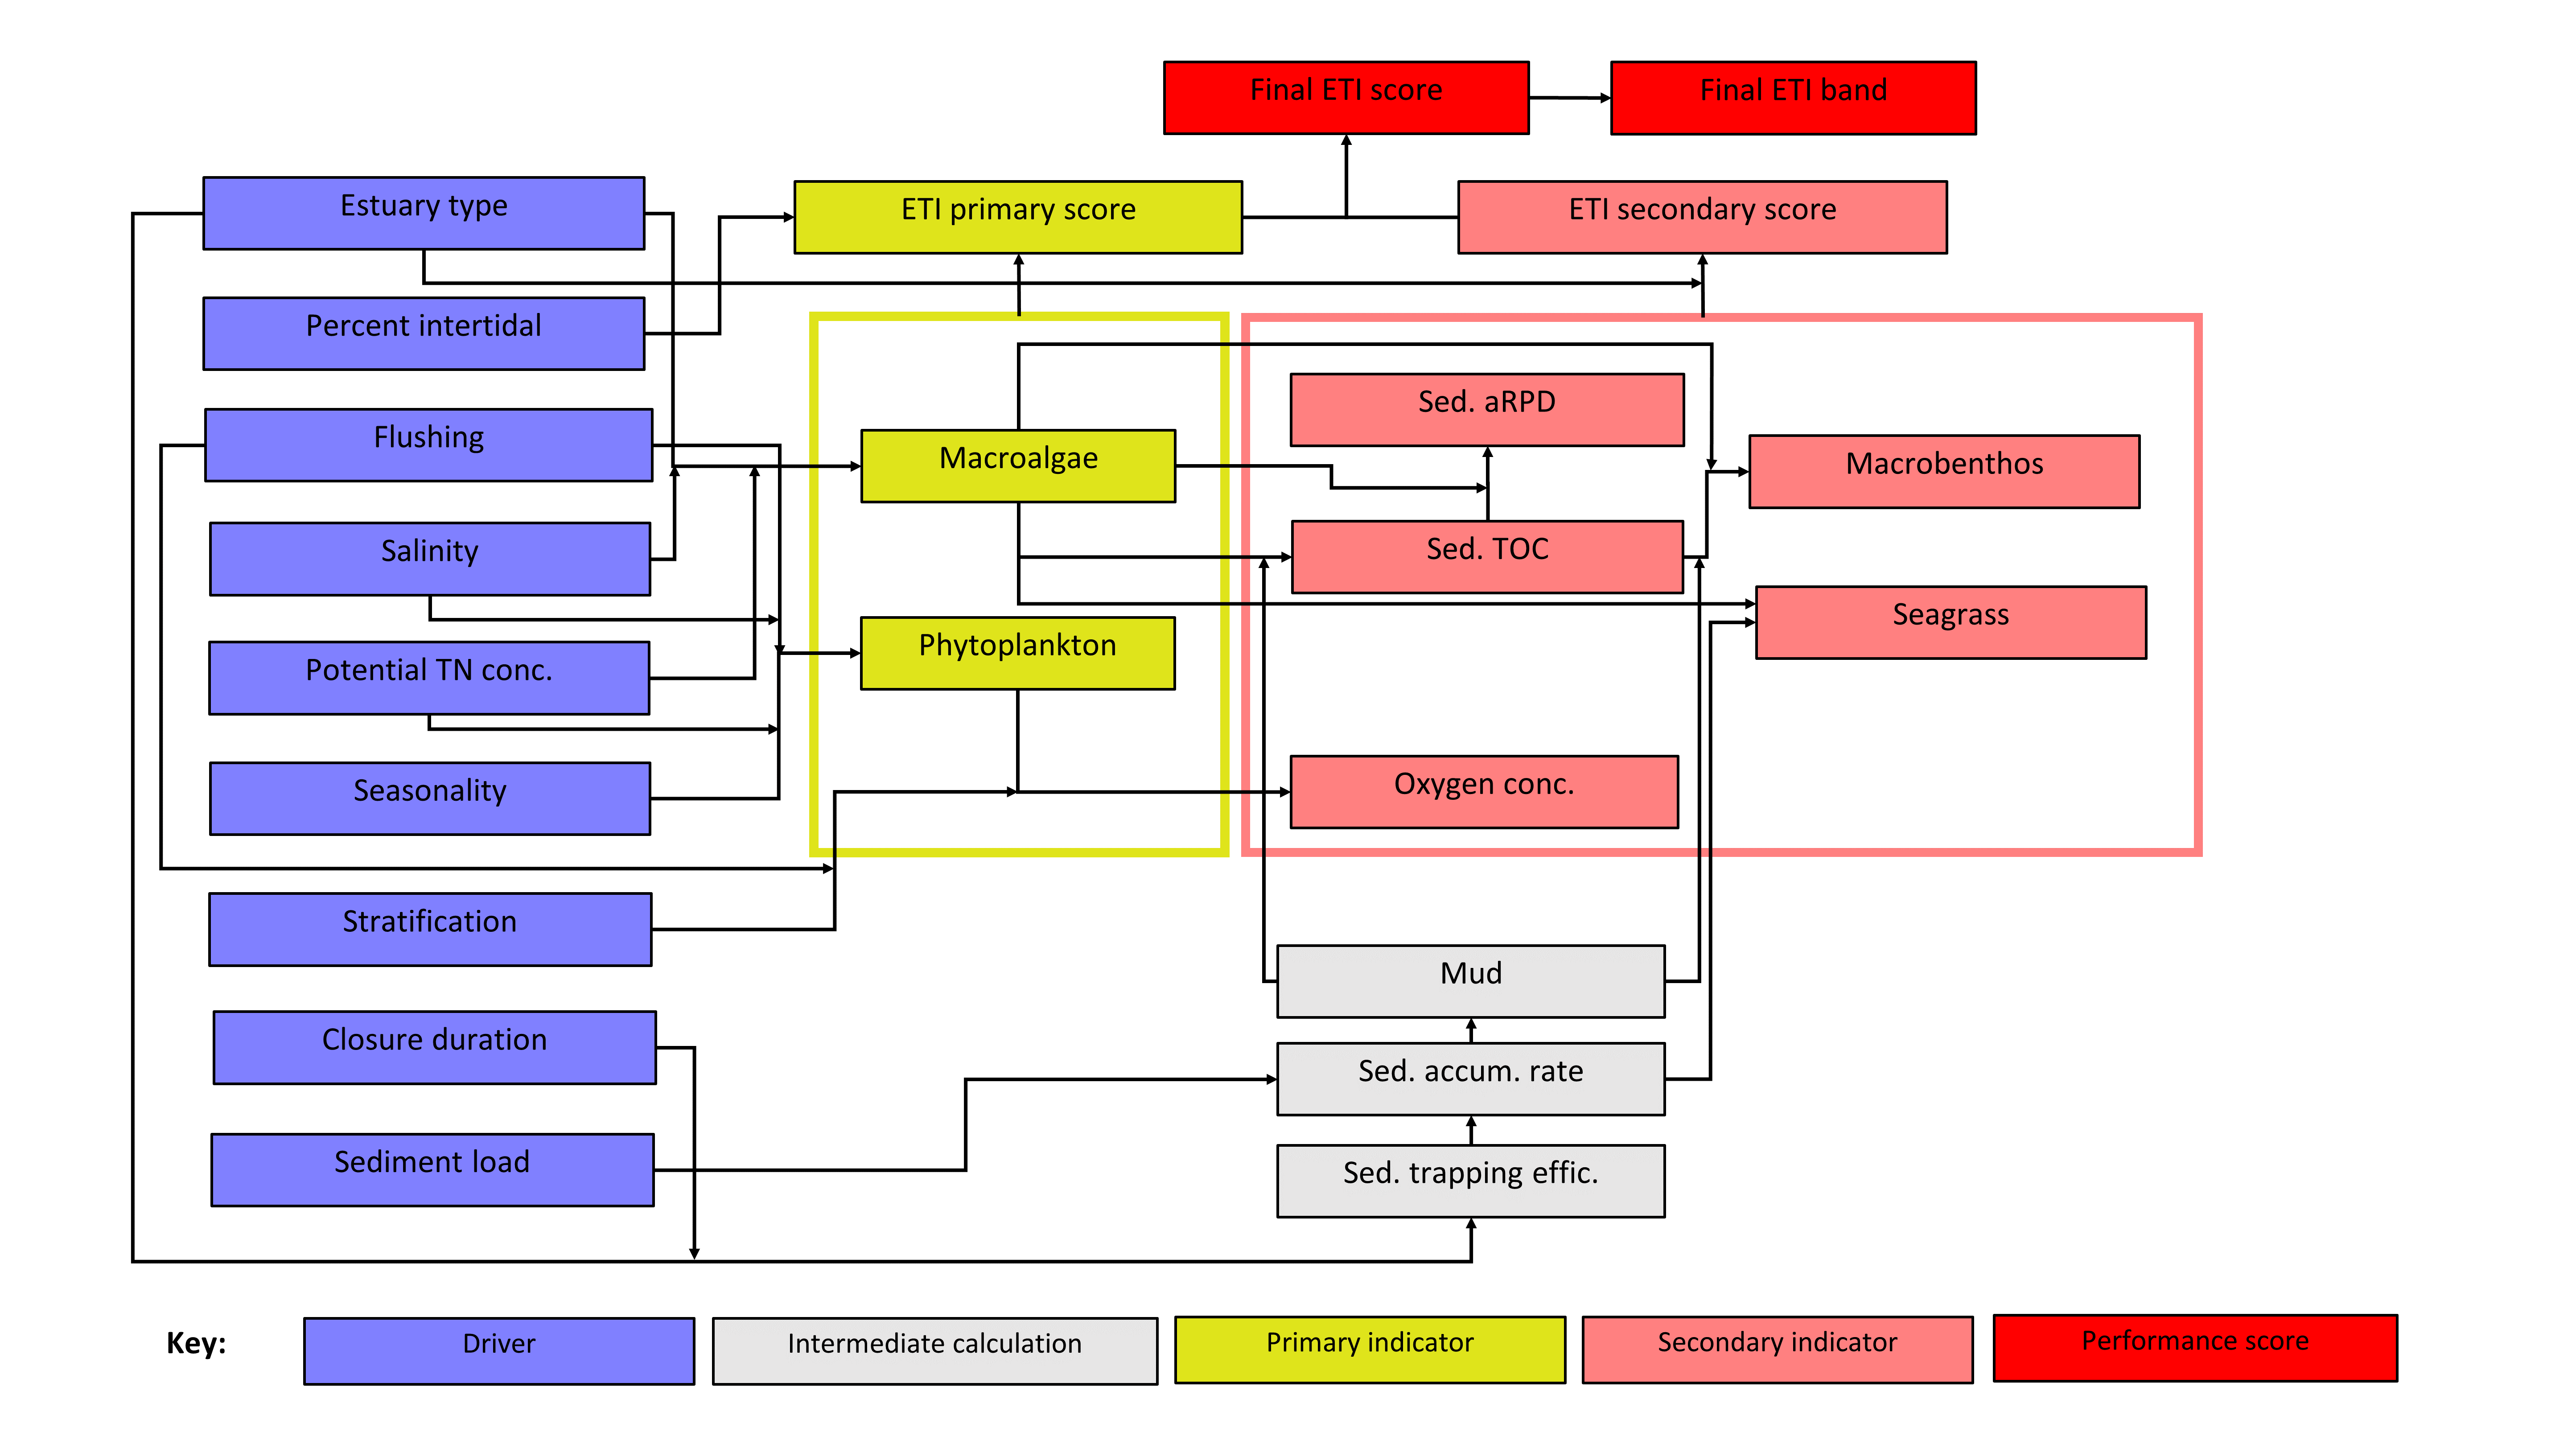
Figure 1. Schematic of the ETI Tool 3 Bayesian Belief Network (BBN). Information for driver nodes (blue nodes) are input by the user and the BBN calculates states of primary and secondary trophic indicators (yellow and pink nodes, respectively). Primary and secondary indicator values are used to produce ETI primary and secondary scores, respectively, which are then combined to give the final ETI performance score (red node). Some secondary nodes are calculated using intermediate calculation nodes (grey nodes) which do not directly contribute secondary indicator scores. All driver node values are available from Tool 1 output (with default input values available for download here), except for stratification, which is decided by the user. For brevity, nodes used for standardising values of primary and secondary indicators prior to input to primary and secondary score nodes are not shown here but are summarised by yellow and pink rectangles, respectively (see Figure 1 on the Using Tool 3 tab. BBN components are further defined in Zeldis & Plew (2022).
The steps needed to run Tool 3 are described below. However, we also recommend that you check out our brief introduction to the BBN approach for more information about BBNs. In addition, there are some tutorials available on the Netica website to help you understand how to run the Netica software.
Downloading and running the BBN
-
Download and install the freely available Netica software. Note that this does not require you to have administration rights on your computer and you will be able to run the ETI BBN model using the free Limited Mode version of Netica.
-
Download the BBN data file and open in Netica.
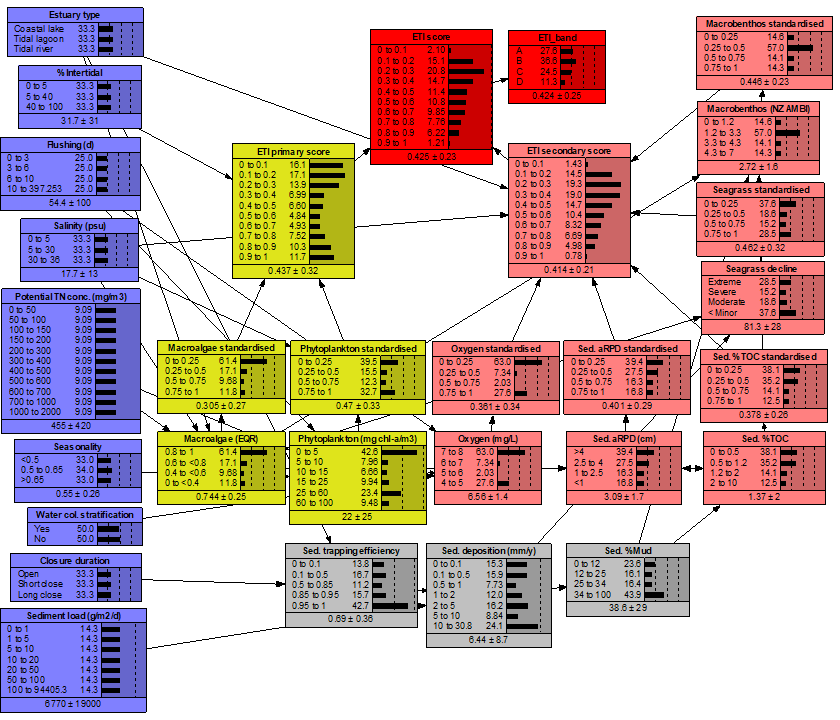
Figure 1. View of the Netica file for the Bayesian Belief Network created for shallow intertidal-dominated estuaries (SIDEs), shallow, short residence time rivers estuaries (SSRTREs) and coastal lakes (ETI_Tool3_v36.neta). Blue boxes are driver nodes with values available from ETI Tool 1, yellow and pink nodes are primary and secondary indicator nodes and the red node is the final ETI score. Grey nodes are intermediate calculation nodes. Indicator nodes that contribute to the scoring nodes have accompanying standardising nodes. Bars represent the conditional probability distributions for the range of values within each node.
- Set the driver nodes (blue boxes) for a SIDE, SSRTRE or coastal lake to estimate its intermediate and indicator nodes (grey, yellow and pink boxes) and to calculate its ETI score at the performance indicator node (red box). Nodes can be set by clicking on the setting or value range for the desired state (Figure 1). Information for the driver nodes may be downloaded from Tool 1. Alternatively, the driver node values can be acquired from the provided input file which contains outputs from Tool 1 for the driver nodes of Tool 3. The driver nodes are:
- Estuary type – the ETI estuary type (SIDE, SSRTRE, coastal lake).
- Percentage intertidal (%) – the % of the total estuary area that is intertidal (Intertidal from Tool 1).
- Flushing (d) – the flushing time of the estuary in days calculated for summer conditions (Tf_summer from Tool 1).
- Salinity (psu) – the annual average salinity of the estuary (EstuarySalinity from Tool 1).
- Potential TN conc (mg/m3) – the annual average potential total nitrogen concentration (TN from Tool 1).
- Seasonality – the ratio of summer to annual estuary potential TN (Estuary_TN_seasonality from Tool 1).
- Stratification – set to yes or no depending on whether thermohaline stratification develops in the estuary.
- Closure duration – this node affects only the state of the Trapping efficiency internal calculation. See
Modelling ICOES(link on left panel) for how the BBN should be configured for intermittently closed and opened estuaries. - Sediment load (g/m2/d) – the average annual fine sediment load (Sed_rate from Tool 1).
- The dilution modelling underpinning flushing time estimates from Tool 1 has not been calibrated for most estuaries and may be unreliable. In cases where flushing times exceed 10 days, set the Flushing node to the maximum state (10 to 397 days) in the BBN Flushing node.
- The settings for the Closure duration and Stratification nodes have been set to default values of open and no, respectively, in the input file derived from Tool 1. These settings may be changed to other closure or stratification settings by the user, if desired.
- In some cases, information may be known about the primary indicator, secondary indicator and intermediate calculation nodes and these can also be set to the known state. For some estuaries, this information may be available for download in the default Tool 2 dataset. Note that manually setting the state within the intermediate nodes can occasionally result in an error message where, based on the parameterisation of the BBN, the value of the intermediate state is not possible given the selected values of the situation and decision nodes. If this occurs, please select different values for the decision or intermediate nodes.
- To save an image of the BBN, go to File > Export Graphics. Results from a given BBN setup can also be saved to Excel using instructions provided on the Netica website.
- To reset the BBN to its original state, right-click on the whitespace and select Remove findings.
Modelling ICOES
ICOES can be modelled using the BBN as follows:
- The ‘Closure duration’ driver node should be set to ‘short close’ (i.e., a few days) or ‘long close’ (i.e., weeks to months). This setting affects only the state of the Trapping efficiency intermediate calculation node. Set closure duration to ‘always open’ if you are not modelling an ICOE.
- Information also needs to be included using the Potential TN concentration and Flushing driver nodes. Data for setting these driver nodes for ICOEs in their closed state can be obtained from data provided in Tool 1 as shown in Table 1. Please refer to the
Background informationtab for more information.
The information underpinning the connections between the nodes in the BBN is described within conditional probability tables, an example of which is shown in Table 1. This information has been accumulated from local knowledge based on New Zealand estuarine science, or from studies made overseas (Table 2; see also Zeldis & Plew, 2022)). This knowledge is used to determine a) relationships of drivers (e.g., nutrient and sediment load) to responses (e.g., macroalgal biomass, muddiness) and b) the probabilities that various states of the drivers will cause the responses to occupy particular states (bands).
ICOE subtypes of SIDEs and SSRTREs are determined by mouth closure state and duration and are modelled in Tool 1 prior to inputting results to Tool 3. This determines which dilution model is employed for calculating potential nitrogen concentration.
Banding is provided for both macroalgae and phytoplankton eutrophication potentials in the BBN. However, the main effects of phytoplankton eutrophication are oxygen depletion and high light attenuation in deeper and often stratified estuarine systems, which typically do not occur in New Zealand SIDEs when they are permanently open. Phytoplankton effects are more likely in SSRTREs, particularly those with longer flushing times. Using the Tool 1 database, we have found that the great majority of estuaries with intertidal areas less than 20% are SSRTREs, while the great majority of SIDEs have intertidal areas greater than 40%. To prevent the phytoplankton primary indicator having effect when operating the BBN for estuaries with intertidal areas greater than 40% (i.e., for SIDEs), the BBN selects the macroalgal primary indicator as the driver of the ETI primary node. For estuaries with intertidal areas less than 5% the BBN selects the phytoplankton primary indicator as the driver of the ETI primary node. If the intertidal area is between 5% and 40%, the BBN considers both macroalgal and phytoplankton indicators, and the ETI primary node is scored using the worst of the macroalgae and phytoplankton indicators.
Although the percent intertidal setting affects whether the ETI primary node is driven by macroalgae or phytoplankton, it does not affect how the nutrient and flushing decision nodes affect the macroalgae and phytoplankton nodes. Therefore, if the estuary is a SIDE, but is known to have areas that have deep holes with high nutrients and low flushing, the user may wish to consider the results of phytoplankton primary indicator in decision-making. Conversely, if the estuary is an SSRTRE, but is known to have small but important intertidal areas, the user may wish to consider results of the macroalgae node.
-
Benham, C.F., Beavis, S.G., Jackson, E.L. (2019). Tolerance of tropical seagrasses Zostera muelleri and Halophila ovalis to burial: Toward an understanding of threshold effects. Estuarine, Coastal and Shelf Science 218: 131-138. https://doi.org/10.1016/j.ecss.2018.11.005
-
Booker, D.J and R.A. Woods. (2014) Comparing and combining physically-based and empirically-based approaches for estimating the hydrology of ungauged catchments. Journal of Hydrology (New Zealand) 508: 227-239.[pdf]
-
Borja, A., Franco, J., Valencia, V., Bald, J., Muxika, I., Belzunce, M.J., Solaun, O. (2004) Implementation of the European water framework directive from the Basque country (northern Spain): a methodological approach. Marine Pollution Bulletin 48: 209-218 [pdf]
-
Bricker, S., Ferreira, J., Simas, T. (2003) An integrated methodology for assessment of estuarine trophic status. Ecological Modelling 169: 39-60. [pdf]
-
Cummins, S.P., Roberts, D.E., Zimmerman, K.D. (2004). Effects of the green macroalga Enteromorpha intestinalis on macrobenthic and seagrass assemblages in a shallow coastal estuary. Marine Ecology Progress Series 266: 77-87. https://www.int-res.com/articles/meps2004/266/m266p077.pdf
-
Green, L., Sutula, M., Fong, P. (2012) How much is too much? Identifying benchmarks of adverse effects of macroalgae on the macrobenthic communtiy in estuarine intertidal flats. Pages 171-187 in S. W. K. Miller., editor. Southern California Coastal Water Research Project 2012 Annual Report. Southern California Coastal Water Research Project, Costa Mesa, CA. [pdf]
-
Hicks, M., Semadeni-Davies, A., Haddadchi, A., Shankar, U., Plew, D. (2019) Updated sediment yield estimator for New Zealand. NIWA Client Report 2018341CH prepared for Ministry for the Environment. NIWA, Christchurch. 190 pp. [pdf]
-
Holmquist, J.G. (1997). Disturbance and gap formation in a marine benthic mosaic: influence of shifting macroalgal patches on seagrass structure and mobile invertebrates. Marine Ecology Progress Series 158: 121-130. https://www.int-res.com/articles/meps/158/m158p121.pdf
-
Hume, T. (2018) The fit of the ETI trophic state susceptibility typology to the NZ coastal hydrosystems typology. NIWA Client Report 2017007CH. NIWA, Christchurch. 34 pp. [pdf]
-
Hume, T., Snelder, T., Weatherhead, M., Liefting, R. (2007) A controlling factor approach to estuary classification. Journal of Ocean and Coastal Management 50: 905-929. [pdf]
-
Pelletier, M.C., Campbell, D.E., Ho, K.T., Burgess, R.M., Audette,C.T., Detenbeck, N.E. (2011) Can sediment total organic carbon and grain size be used to diagnose organic enrichment in estuaries? Environmental Toxicology and Chemistry 30: 538-547. [pdf]
-
Plew, D.R., Zeldis, J.R., Dudley, B.D., Whitehead, A.L., Stevens, L.M., Robertson, B.M., Robertson, B.P. (2020) Assessing the eutrophic susceptibility of New Zealand estuaries. Estuaries and Coasts: 1-19.10.1007/s12237-020-00729-w. [pdf]
-
Plew, D.R., Zeldis, J.R., Shankar, U., Elliott, A.H. (2018) Using simple dilution models to predict New Zealand estuarine water quality. Estuaries and Coasts 41: 1643-1659. [pdf]
-
Robertson, B.P., J.P.A. Gardner, and C. Savage. (2015) Macrobenthic–mud relations strengthen the foundation for benthic index development: A case study from shallow, temperate New Zealand estuaries. Ecological Indicators 58: 161-174. [pdf]
-
Robertson, B., L. Stevens, B. Robertson, J. Zeldis, M. Green, A. Madarasz-Smith, D. Plew, R. Storey, T. Hume, and M. Oliver. (2016a) NZ Estuary Trophic Index Screening Tool 1. Determining eutrophication susceptibility using physical and nutrient load data. Prepared for Envirolink Tools Project: Estuarine Trophic Index, MBIE/NIWA Contract No: C01X1420: 47 pp. [pdf]
-
Robertson, B., Stevens, L., Robertson, B., Zeldis, J., Green, M., Madarasz-Smith, A., Plew, D., Storey, R. Oliver, M. (2016b) NZ Estuary Trophic Index Screening Tool 2. Determining Monitoring Indicators and Assessing Estuary Trophic State. Prepared for Envirolink Tools Project: Estuarine Trophic Index, MBIE/NIWA Contract No C01X1420: 68pp. [pdf]
-
Robertson, B.P., Savage, C., Gardner, J.P.A., Robertson, B.M., Stevens, L.M. (2016c) Optimising a widely-used coastal health index through quantitative ecological group classifications and associated thresholds. Ecological Indicators 69: 595-605. [pdf]
-
Siciliano, A., Schiel, D.R., Thomsen, M.S. (2019). Effects of local anthropogenic stressors on a habitat cascade in an estuarine seagrass system. Marine and Freshwater Research 70(8): 1129-1142. https://doi.org/10.1071/MF18414
-
Sutula, M., Green, L., Cicchetti, G., Detenbeck, N., Fong, P. (2014) Thresholds of adverse effects of macroalgal abundance and sediment organic matter on benthic habitat quality in estuarine intertidal flats. Estuaries and Coasts 37: 1532-1548. [pdf]
-
Townsend, M., and D. Lohrer. (2015) ANZECC Guidance for Estuary Sedimentation. NIWA Client Report HAM2015-096 prepared for the Ministry of the Environment. NIWA, Hamilton. 45 pp. [pdf]
-
Whitehead, A., C. Depree, and J. Quinn. (2019) Seasonal and temporal variations in water quality in New Zealand rivers. Prepared for Ministry for the Environment 2019024CH. 79 pp. [pdf]
-
Zabarte-Maeztu, I., Matheson, F.E., Manley-Harris, M., Davies-Colley, R.J., Hawes, I. (2021). Fine sediment effects on seagrasses: A global review, quantitative synthesis and multi-stressor model. Marine Environmental Research 171: 105480. https://doi.org/10.1016/j.marenvres.2021.105480
-
Zeldis, J., Plew, D., Whitehead, A., Madarasz-Smith, A., Oliver, M., Stevens, L., Robertson, B., Burge, O., Dudley, B. (2017a). The New Zealand Estuary Trophic Index (ETI) Tools: Web Tool 1 - Determining Eutrophication Susceptibility using Physical and Nutrient Load Data. Ministry of Business, Innovation and Employment Envirolink Tools: C01X1420. https://shiny.niwa.co.nz/Estuaries-Screening-Tool-1/
-
Zeldis, J., Whitehead, A., Plew, D., Madarasz-Smith, A,. Oliver, M., Stevens, L., Robertson, B., Storey, R., Burge, O., Dudley, B. (2017b). The New Zealand Estuary Trophic Index (ETI) Tools: Tool 2 - Assessing Estuary Trophic State using Measured Trophic Indicators. Ministry of Business, Innovation and Employment Envirolink Tools Contract: C01X1420. https://shiny.niwa.co.nz/Estuaries-Screening-Tool-2/
-
Zeldis, J., Storey, R., Plew, D., Whitehead, A., Madarasz-Smith, A., Oliver, M., Stevens, L., Robertson, B., Dudley, B. (2017c). The New Zealand Estuary Trophic Index (ETI) Tools: Tool 3 - Assessing Estuary Trophic State using a Bayesian Belief Network. Ministry of Business, Innovation and Employment Envirolink Tools Contract: C01X1420. https://shiny.niwa.co.nz/Estuaries-Screening-Tool-3/
-
Zeldis, J. and D. Plew. (2020) Estuary Trophic Index Bayesian Belief Network: structure and conditional probability table description. NIWA Internal Report 2020276CH. NIWA, Christchurch. 53 pp. [pdf]
-
Zeldis, J. and D. Plew. (2022) Predicting and scoring estuary ecological health using a Bayesian Belief Network. Frontiers in Marine Science 9:898992. https://doi.org/10.3389/fmars.2022.898992