
Although nutrient enrichment threatens many New Zealand estuaries, guidance on how to assess the extent of eutrophication (including indices and indicators that are useful for management) is limited. As a result, it has been difficult to:
- Determine the current state of estuaries with regard to eutrophication;
- Assess the effects of the recent landuse intensification and change on estuaries;
- Gauge the consequences for estuaries of nutrient limits for freshwater (e.g., the National Policy Statement for Freshwater Management, NPSFM, 2014); and
- Set nutrient load limits to achieve estuarine objectives.
In response, regional council coastal scientists sought advice via the coastal Special Interest Group (cSIG), with funding through Envirolink Tools Grant (Contract No. C01X1420), on the development of a nationally consistent approach to the assessment of estuary eutrophication, including nutrient load thresholds. The purpose of this project, called the NZ Estuary Trophic Index (ETI), is to assist regional councils in determining the susceptibility of an estuary to eutrophication, assess its current trophic state, and assess how changes to nutrient load limits may alter its current state. The project does this by providing tools for determining estuary eco-morphological type, where an estuary sits along the ecological gradient from minimal to high eutrophication, and providing stressor-response tools (e.g., empirical relationships, nutrient models) that link the ecological expressions of eutrophication (measured using appropriate trophic state indicators) with nutrient loads (e.g., macroalgal biomass/nutrient load relationships).
In terms of the regional council planning framework, the ETI provides vital supporting guidance for underpinning the ecological health component of regional plans by identifying relevant estuary attributes and outcomes for inclusion in plans, defining methods and indicators to measure ecosystem health attributes, and providing guidelines to assess whether or not the outcomes are being met.
The ETI provides three tools:
- Tool 1: Determining eutrophication susceptibility using physical and nutrient load data
- Tool 2: Assessing Estuary Trophic State using measured trophic indicators
- Tool 3: Assessing Estuary Trophic State using a Bayesian Belief Network
Details of when to use each tool and the knowledge underpinning the tools can be found on the Welcome and Background Information tabs, respectively, for each tool.
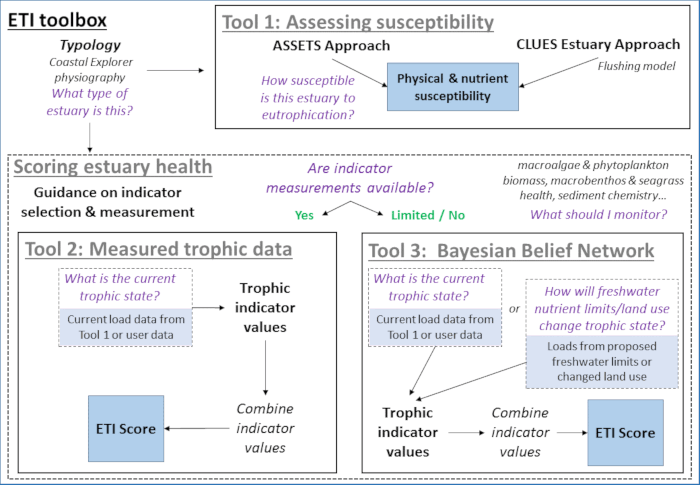
Figure 1. Concept diagram of the ETI, showing relationships between ETI Tools 1, 2 and 3. Tool 1 provides information on estuary susceptibility to eutrophication based on estuary type, its physical attributes and nutrient loading. Tool 2 provides scores for estuary trophic health based on measured trophic indicator values. Tool 3 provides trophic scores under under scenarios of changed land use or load limits, and/or when values of trophic state indicators are lacking.
Disclaimer
Whilst NIWA has used all reasonable endeavours to ensure that the information contained in this website is accurate, NIWA does not give any express or implied warranty as to the accuracy of the information contained herein. This website has been reviewed internally by NIWA and meets NIWA standards for website delivery.
ETI Tool 2 is a monitoring approach that characterises the ecological gradient of estuary trophic condition for relevant ecological response indicators (e.g., macroalgal biomass, dissolved oxygen), and provides a means of translating these ratings into an overall estuary trophic index (ETI) score. The tool provides guidance on which condition indicators to use for monitoring the various estuary types (and why they have been chosen), as well assessing an estuary’s trophic state based on indicator monitoring results (Robertson et al. 2016). The latter requires measurement data of primary indicators (e.g., macroalgae, phyoplankton) and secondary indicators (e.g., oxygen, redox potential depth, macrobenthos condition) of eutrophication and trophic state (see Glossary for definitions of words in bold).
Details of the guidance for monitoring of indicators and the knowledge underpinning the bandings of the indicators with respect to estuary health are available in Robertson et al. (2016).
When to use ETI Tool 2
ETI Tool 2 is applicable for an estuary when data are available for at least one primary indicator and at least one secondary indicator . A full list of possible primary and secondary indicators, their measurement, and required units, can be downloaded from the 1. Download data template tab under the Calculate ETI scores menu. These are also described in more detail in Robertson et al. (2016).
Guidance is also provided on when to use indicators for each estuary type. For example, it is recommended that the phytoplankton indicator be applied only to moderately deep tidal river estuaries (SSRTREs) and deep, long-residence time estuaries (DSDEs), and not to shallow tidal lagoon estuaries (SIDEs) when the latter are in the open state (Robertson et al. 2016).
ETI Tool 2 provides for 82 New Zealand estuaries from a database compiled by Wriggle Coastal Consultants during the ETI Tool 2 development process (Robertson et al. 2016). You can calculate ETI scores using the default data (shown in the table below) or choose to analyse your own data by using the Select which data to use buttons. If you choose to upload your own data, we recommend downloading the default data file to use as a data template. For information about each of the variables in the data template, including the correct units, please download the metadata file.
When you have selected your dataset, please navigate to 2. Plot raw data.
Use these plots to view and interrogate the raw data before calculating ETI scores in Step 3.
Please click the calculate ETI button for ETI scores. Note that NA will be returned for sites that lack the minimum number of required variables (Robertson et al. 2016a).
The final ETI scores can be downloaded using the Download Results button, along with the metadata table that explains the output columns and their units. The results can also be plotted using the 4. Plot ETI scores tab.
Calculation of ETI scores
ETI Tool 2 calculates scores for estuaries that have at least one each of the required primary and secondary indicators relevant to the estuary type. All values are re-scaled to ensure comparability between indicators. The maximum (i.e., worst) primary indicator score and the average of the secondary indicator scores are calculated, and thereafter the average of the max primary and mean secondary scores is taken and scaled between 0 (least eutrophic) and 1 (most eutrophic). Estuaries for which insufficient indicators are provided will have NA returned for their score. Further details on the required variables can be found by downloading the metadata from the 1. Download data template tab under the Calculate ETI scores menu.
ETI Tool 2 includes a scaling approach to turn the values of the primary and secondary indicator values into numbers between 1 and 16. These are then combined to calculate the ETI score.
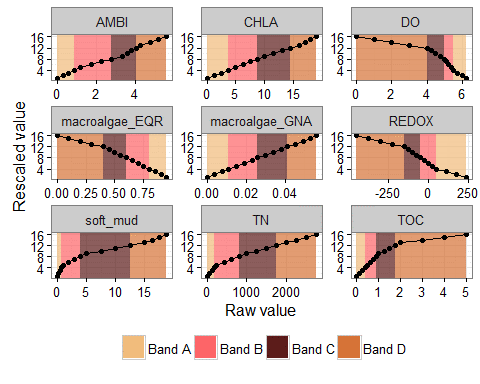
Figure 1. The relationship between raw and scaled ETI indicators. Scales are shown for the ETI indicators, along with their bandings from Robertson et al. (2016). These range from Band A (1:4 on the y-axis) = Minimal Eutrophic Symptoms, to Band D (13:16 on the y-axis) = High Eutrophic Symptoms.
ETI Tool 2 then uses the rescaled values of indicators to calculate the ETI score as:
$$ETI = \frac{max(primary) + mean(secondary)}{32}$$
ETI bands are calculated from the ETI score as shown below.
| ETI score | ETI band |
|---|---|
| 0 to ≤0.25 | A |
| >0.25 to ≤0.50 | B |
| >0.50 to ≤0.75 | C |
| >0.75 to 1.00 | D |
- Bricker, S., Ferreira, J., Simas, T. (2003) An integrated methodology for assessment of estuarine trophic status. *Ecological Modelling* 169: 39-60. [view online]
-
Hume, T. (2018) The fit of the ETI trophic state susceptibility typology to the NZ coastal hydrosystems typology. NIWA Client Report 2017007CH: 34. [view online]
-
Hume, T., Gerbeaux,P., Hart, D., Kettles, H., Neale, D. (2016) A classification of New Zealand’s coastal hydrosystems. NIWA Client Report HAM2016-062: 112.
-
Hume, T., Snelder, T., Weatherhead, M., Liefting, R. (2007) A controlling factor approach to estuary classification. Journal of Ocean and Coastal Management 50: 905-929. [view online]
-
Plew, D.R., Zeldis, J.R., Shankar, U., Elliott, A.H. (2018). Using simple dilution models to predict New Zealand estuarine water quality. Estuaries and Coasts 41: 1643-1659. [view online]
-
Robertson, B.M., Gillespie, P.A., Asher, R.A., Frisk, S., Keeley, N.B., Hopkins, G.A., Thompson, S.J., Tuckey, B.J. (2002). Estuarine Environmental Assessment and Monitoring: A National Protocol. Part A. Development, Part B. Appendices, and Part C. Application. Prepared for supporting Councils and the Ministry for the Environment. Sustainable Management Fund Contract No. 5096. [view online]
-
Robertson, B.P., Gardner, J.P.A., Savage, C. (2015). Macrobenthic – mud relations strengthen the foundation for benthic index development : A case study from shallow, temperate New Zealand estuaries. Ecological Indicators 58: 161–174. [view online]
-
Robertson, B., Stevens, L., Robertson, B., Zeldis, J., Green, M., Madarasz-Smith, A., Plew, D., Storey, R. Oliver, M. (2016a) NZ Estuary Trophic Index Screening Tool 2. Determining Monitoring Indicators and Assessing Estuary Trophic State. Prepared for Envirolink Tools Project: Estuarine Trophic Index, MBIE/NIWA Contract No C01X1420: 68. [view online]
-
Robertson, B.P., Savage, C., Gardner, J.P.A, Robertson, B.M., Stevens, L.M. (2016b). Optimising a widely-used coastal health index through quantitative ecological group classifications and associated thresholds. Ecological Indicators 69: 595–605. [view online]